Time Log Teams – time spent on other Teams’ sites (must have 3 entries or more):
Date: Feb. 27, 2026 From: 08:45am To: 09:00am
Date: Feb. 27, 2026 From: 11:30pm To 11:45pm
Date: Feb. 29, 2026 From: 11:15pm – 12:00pm
Date: Mar. 1, 2026 From: 02:00pm – 02:30pm
Time Log Students – time spent on other students’ sites (must have 3 entries or more):
Date: Feb 23, 2026 From: 08:00pm To: 09:30pm
Date: Feb. 24, 2026 From: 10:00pm To: 10:30pm
Date: Feb. 26, 2026 From: 09:30pm To: 10:00pm
Date: Feb. 27-28, 2026 From: 11:45pm To: 12:15am
Essay I. Summary of your activities in your contents including new contents created (one paragraph). Provide all the hyperlinks (clickable) of new contents you have created this week.
I add two new posts this week. One post is titled My Spring Break Plan where I shared some information on a hot-spring town that I’m planning to visit during the upcoming spring break. This post is added to my homepage menu under My Life category. Another post that I added is titled Composite Layup Manufacturing. This post is an introduction to aircraft composite material where I shared what I learned during my training at work. This post is added under My Learning category. I kept my tag cloud updated by adding new relevant tags to each post. I also kept track to visitors’ comments and provide response whenever I can.
Similar to other homework assignments, I updated my HWs menu to include HW8 with the summary post and the two new posts content.
I also added added a Thank You page to my menu as part of the assignment to implement conversion event.
Essay II. Summary of your “Thank you” event conversion (add screenshots) (one paragraph)
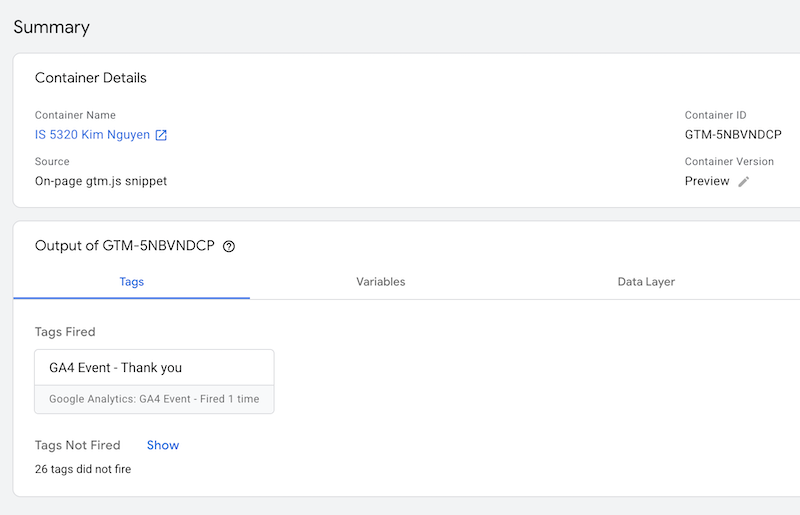
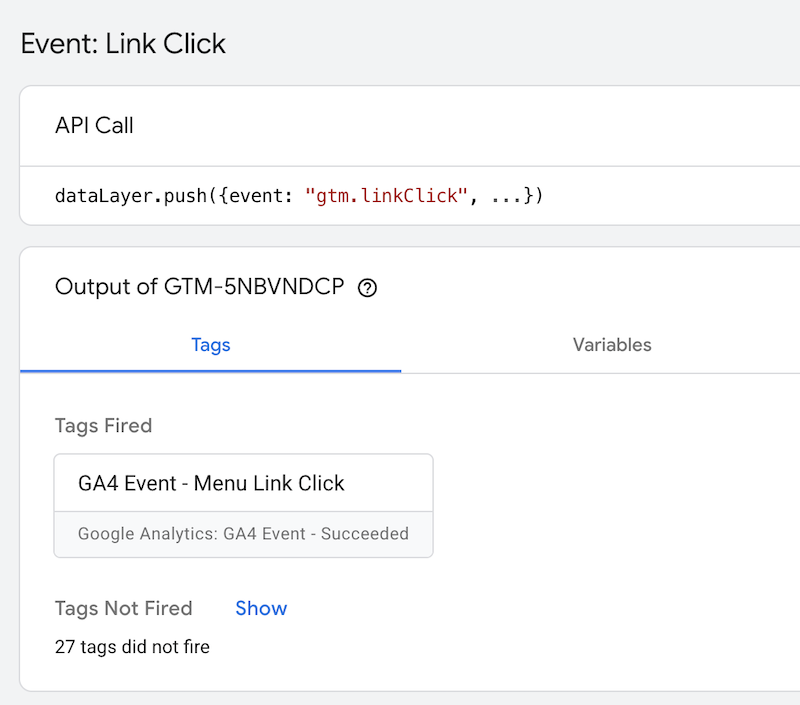
I created a tag within Google Tag Manager with a trigger to fire the tag whenever someone view the Thank You page. This was done similar to how tags were created in the previous assignment 7. Initially, I tried to create this using a custom event from my GA4 Admin page under Data Display. However, this method seems to not be working correctly and it was not a recommended approach from the article. Below is an image showing the Thank You page tag fired successfully.
In GA4 Admin page under Event, I marked the new Thank You event created in Google Tag Manager as a key event to be used for conversion. I also updated the counting method to once per session to avoid inflated data and I gave a default key event value of $1.
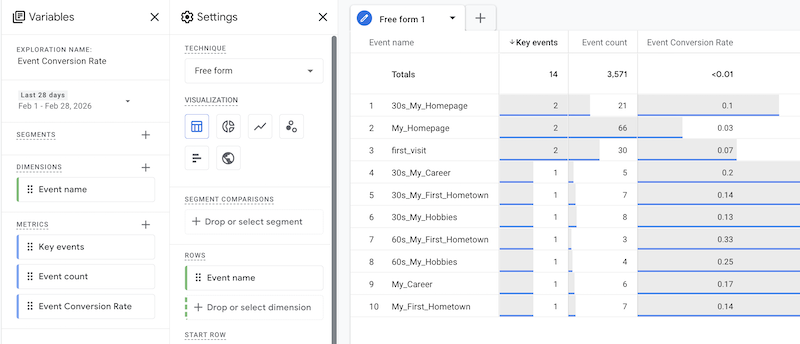
In GA4 Exploration, I created an Event Conversion Rare report as seen in the image below. Currently, this report does not have data from my Thank You page key event because the event is newly created and marked as key, and it might take about 24-48 hours for data to be collected and reflected in the report. It does however show the conversion rates for some of the events that I created from last week. These events were marked as key a day before so I can see some data. The Event Conversion Rate is a custom metric calculated by taking the number of Key Event divided by Event Count. It can be seen that in the past day or two, I have two first_visit from classmates. The total of first_visit on my page is 30 and the Event Conversion Rate for this key event is 7%.
Essay III. Summary of your “menu click” event conversion (add screenshots) (one paragraph)
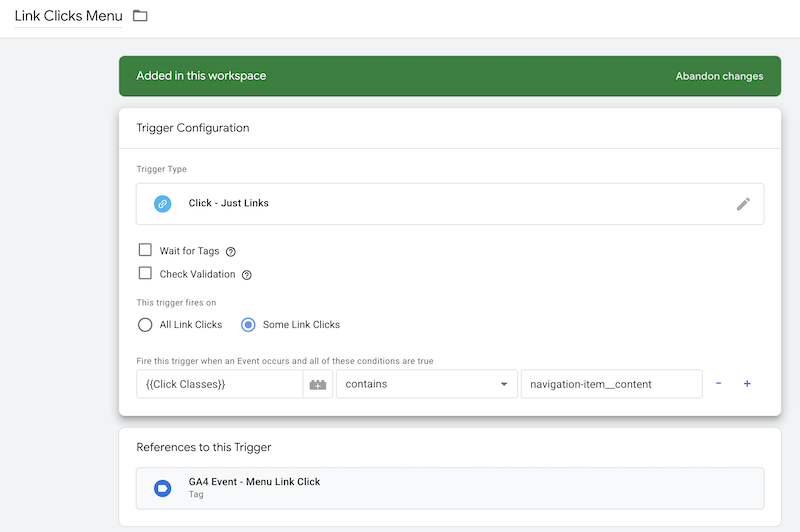
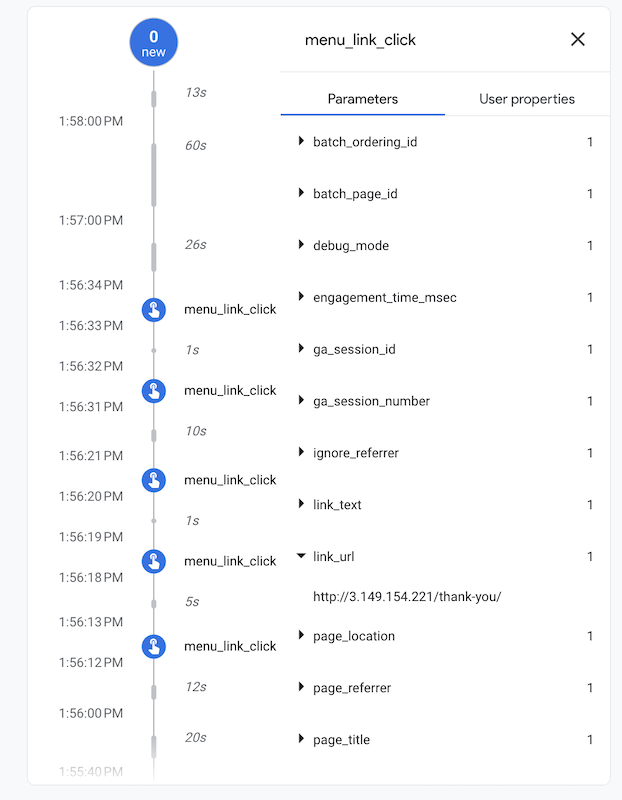
I created a new tag in Google Tag Manager with a Menu Click Trigger when a user clicks on my navigation menu (click classes contain nativation-item_content). I also checked that this tag fired successfully. Link text and link url were added as event parameters and can be seen in debug view under data display. These activities are captured in the images below.
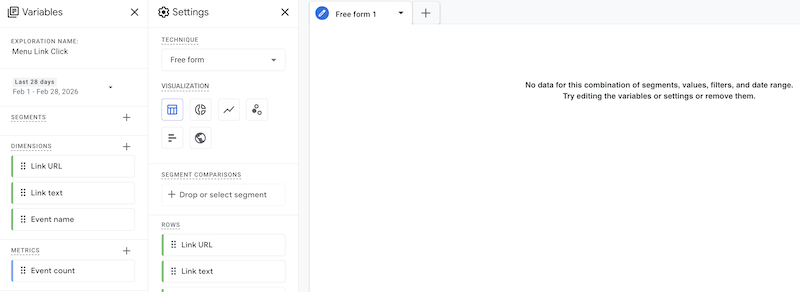
I created a customer report called Menu Link Clicks under Explorations to see how many clicks each of my menu item gets. Currently, there’s no data to display yet because there is a bit of a delay between 24-48 hours after the event is marked as key for the data to be collected and imported. This report will provide powerful insight into what categories the users are most interested in to help me build future content and improve my menu navigation design.
Leave a Reply