Author: knguyen

  • HW10 Summary

    Time Log Teams – time spent on other Teams’ sites (must have 3 entries or more):
    Date: Mar. 8, 2026 From: 08:00pm To: 08:30pm
    Date: Mar. 9, 2026 From: 10:00pm To 10:30pm
    Date: Mar. 13, 2026 From: 12:15pm To: 12:45pm
    Date: Mar. 14, 2026 From: 06:15pm To: 06:45pm

    Time Log Students
     – time spent on other students’ sites (must have 3 entries or more):
    Date: Mar. 8, 2026 From: 07:30pm To: 08:00pm
    Date: Mar. 9, 2026 From: 9:30pm To: 10:00pm
    Date: Mar. 13, 2026 From: 11:45am To: 12:15pm
    Date: Mar. 14, 2026 From: 06:45pm To: 07:15pm

    Essay I. Summary of your activities in your contents including new contents created (one paragraph). Provide all the hyperlinks (clickable) of new contents you have created this week.

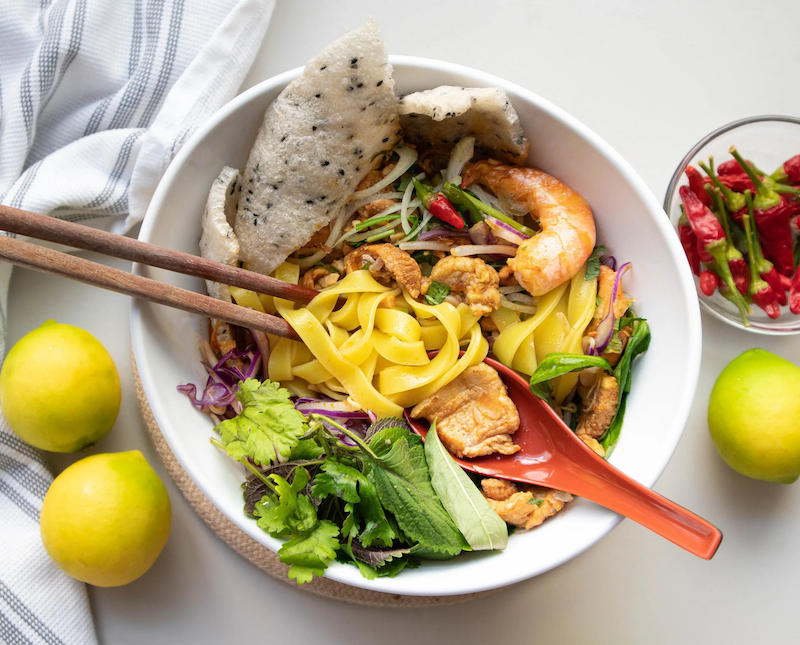
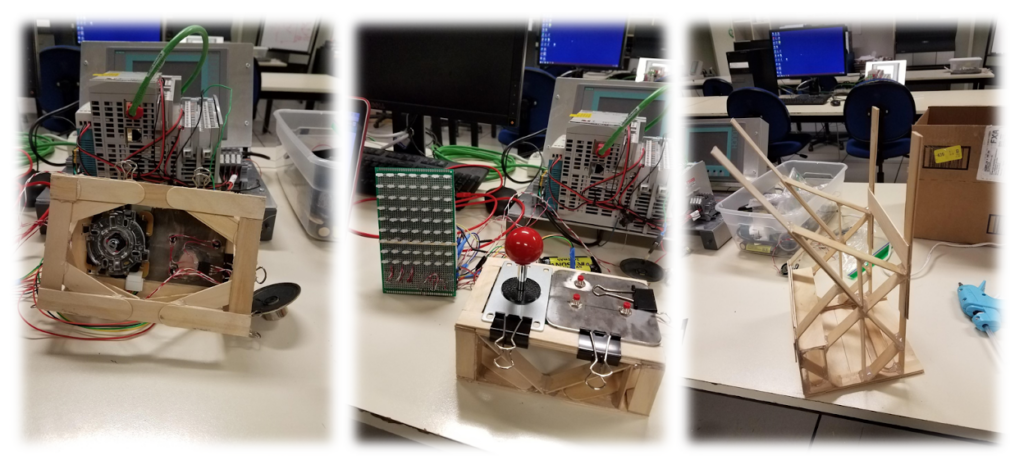
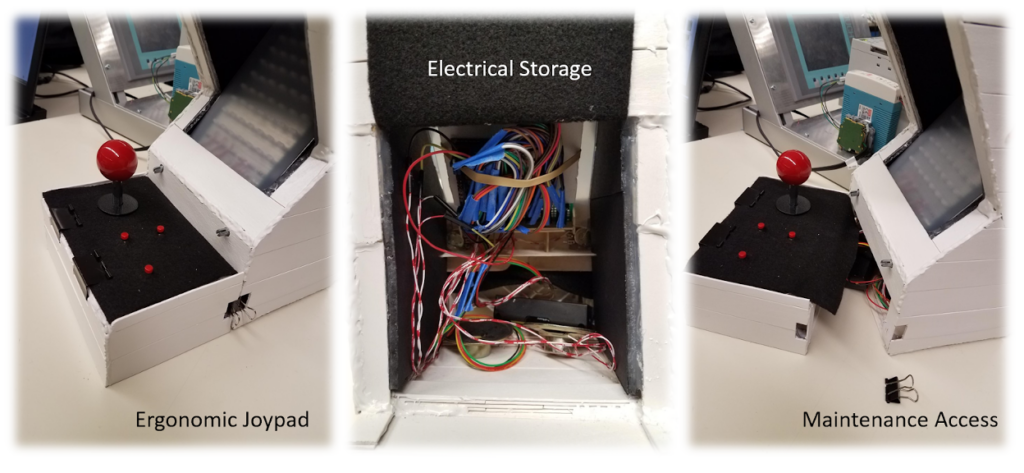
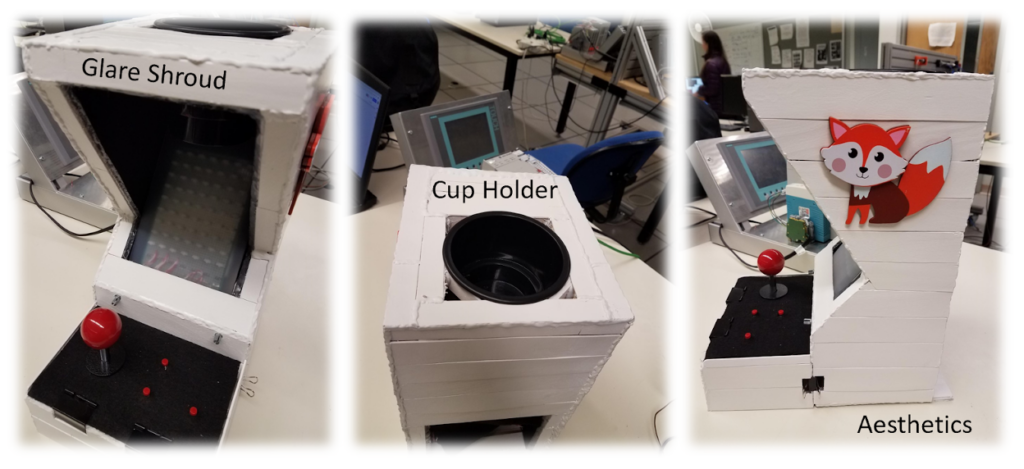
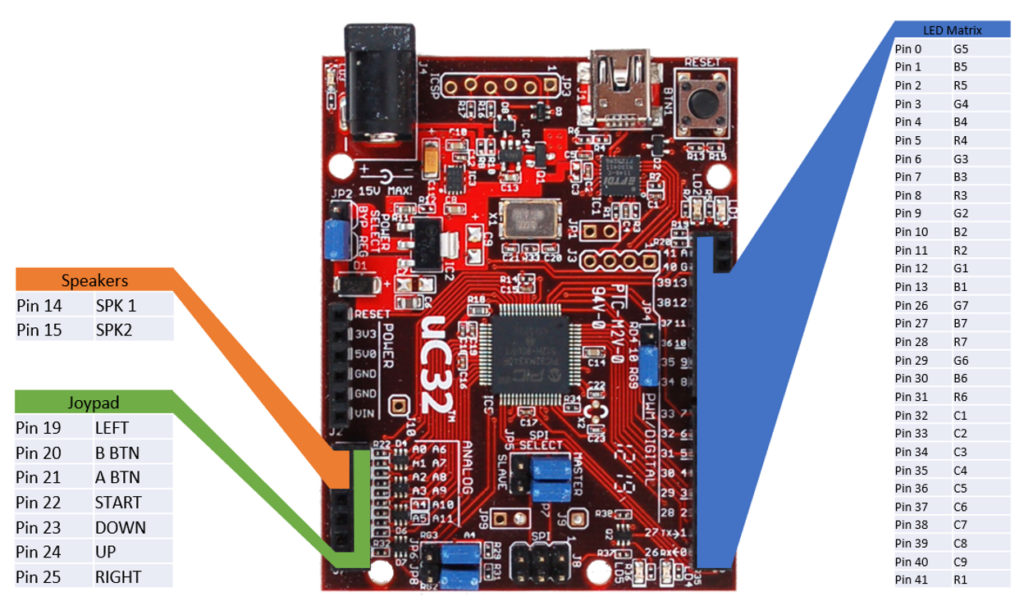
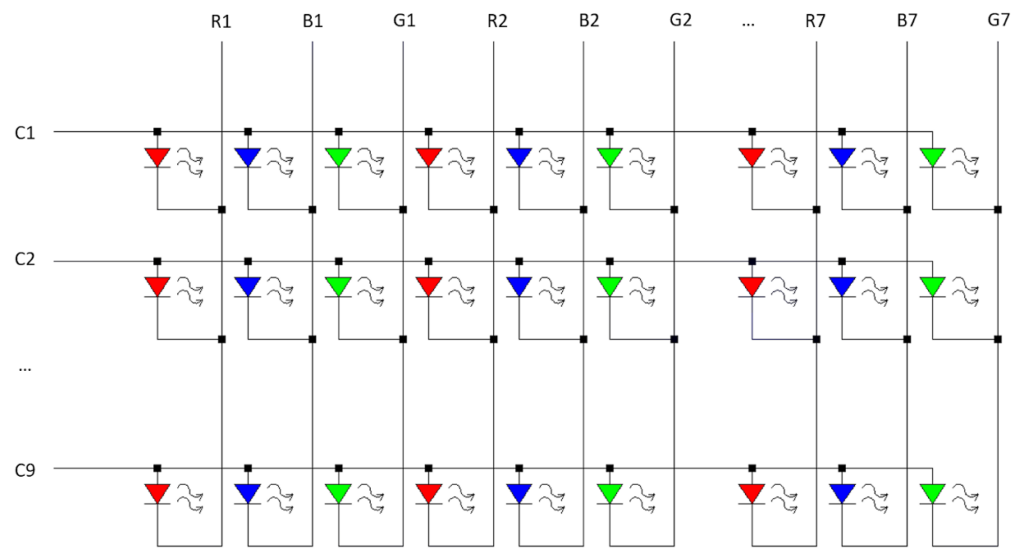
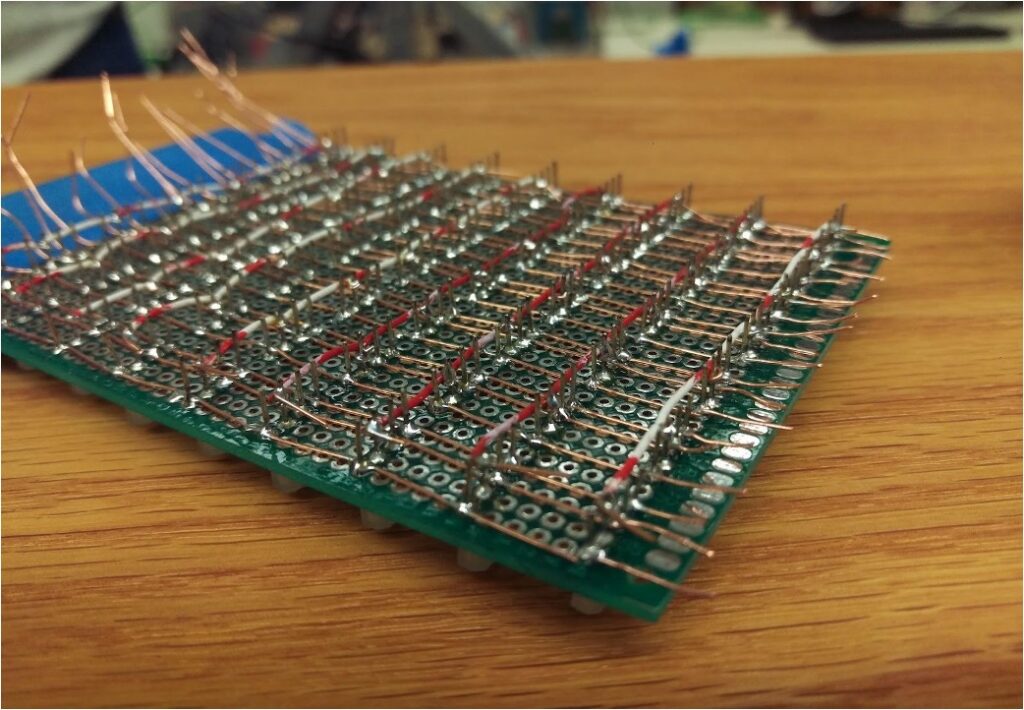
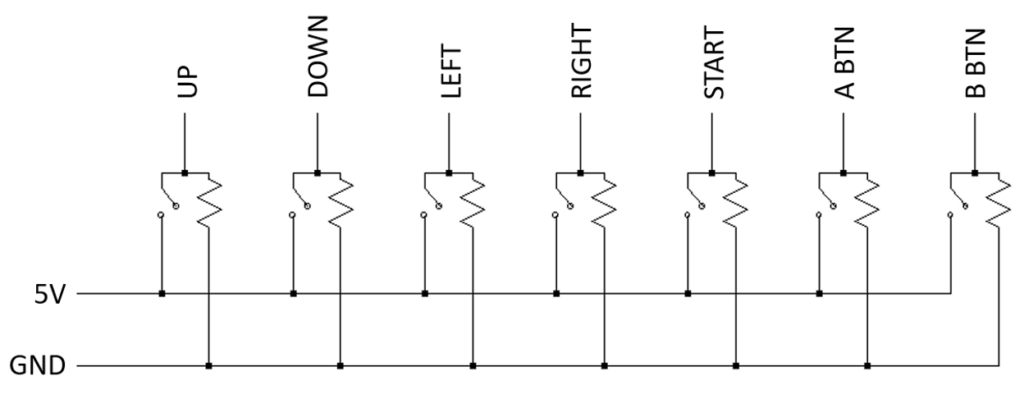
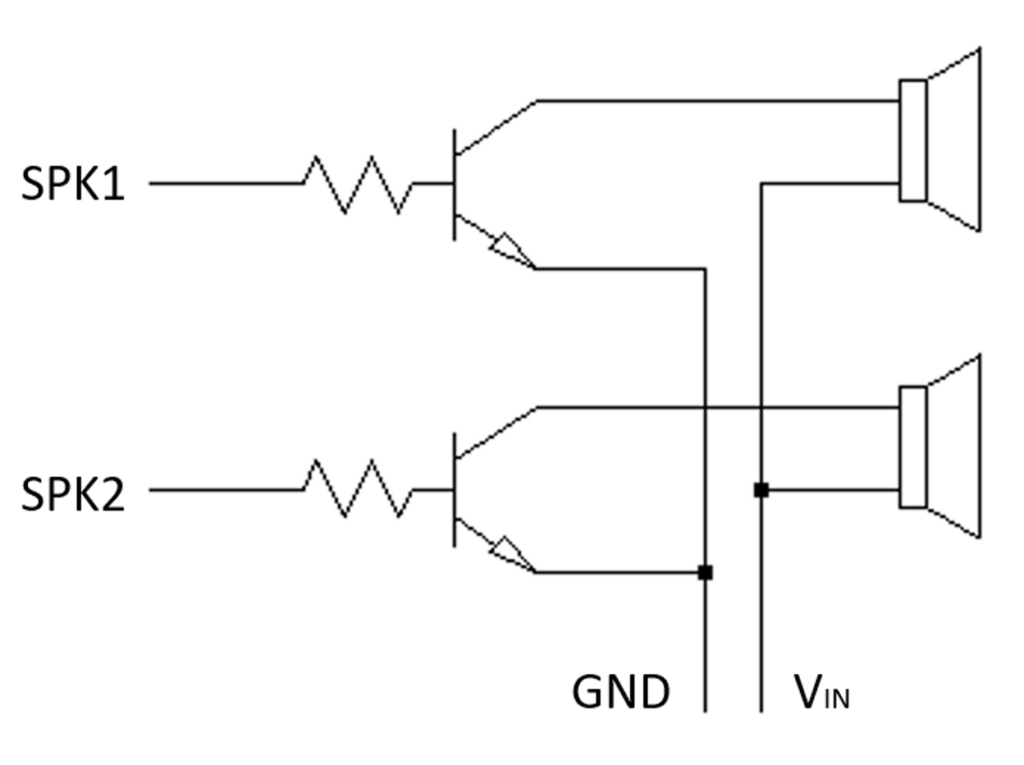
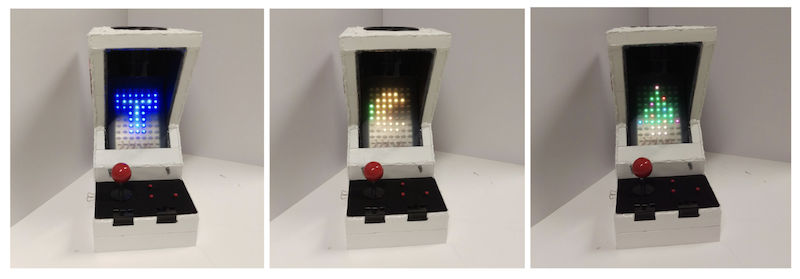
    I added two new posts, “Mechatronic Project – Arcade Game Machine” under My Life category and “My Viet Food Guide” under My Learning category. The first post is about an undergraduate project that I’ve worked on where I and my team built an arcade game machine from scratch. I uploaded a Youtube video and embedded the link into the post so that visitors can watch how the machine works. The second post is an introduction to a view of the Vietnamese noodle dishes that I enjoy that are less well known among non Vietnamese. In each of the post, I added new tags so that they are added to the tag cloud at the end of the homepage.

    Mechatronic Project – Arcade Game Machine

    My Viet Food Guide

    For this week homework menu, I added a new page HW10 to the navigation bar. This page features the three new posts created for this week. The new posts are automatically added to the My learning and My Life category pages. These category pages are filtered to display only posts that belong to the category.

    HW10

    HW10 Summary

    My Life

    My Learning

    Essay II. Summary of your KPI table (add screenshots or table) (one paragraph excluding the KPI table)

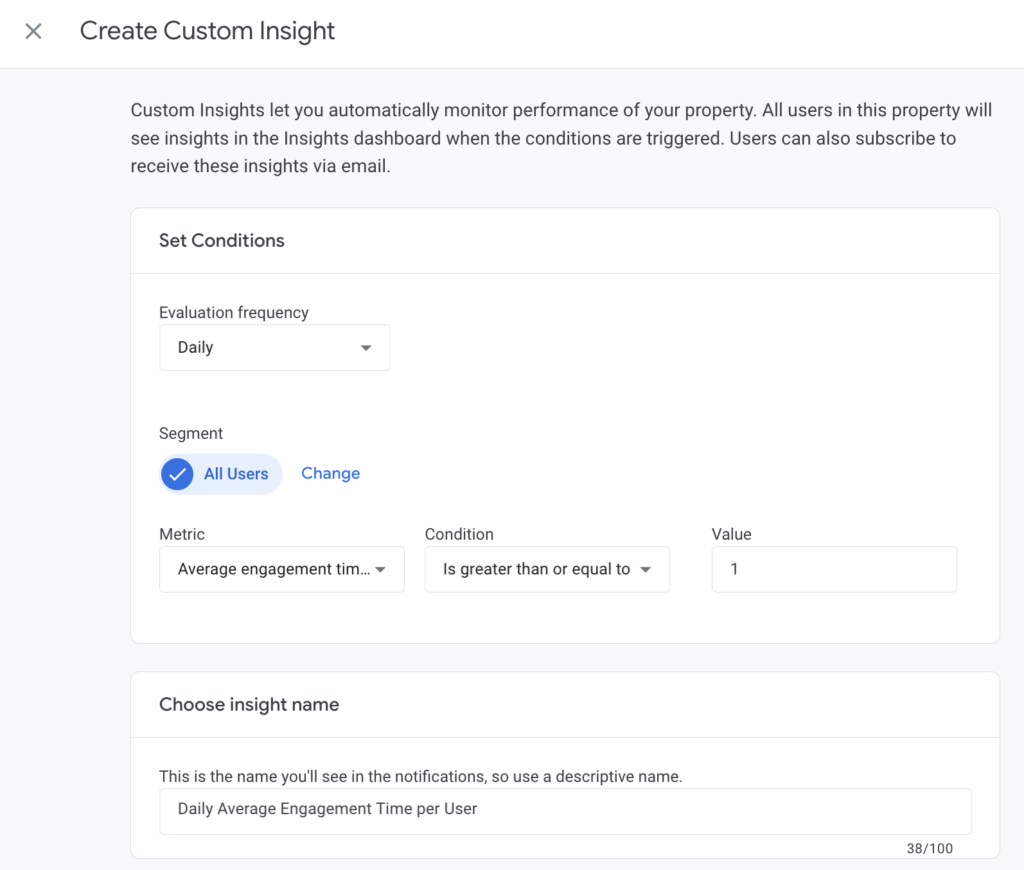
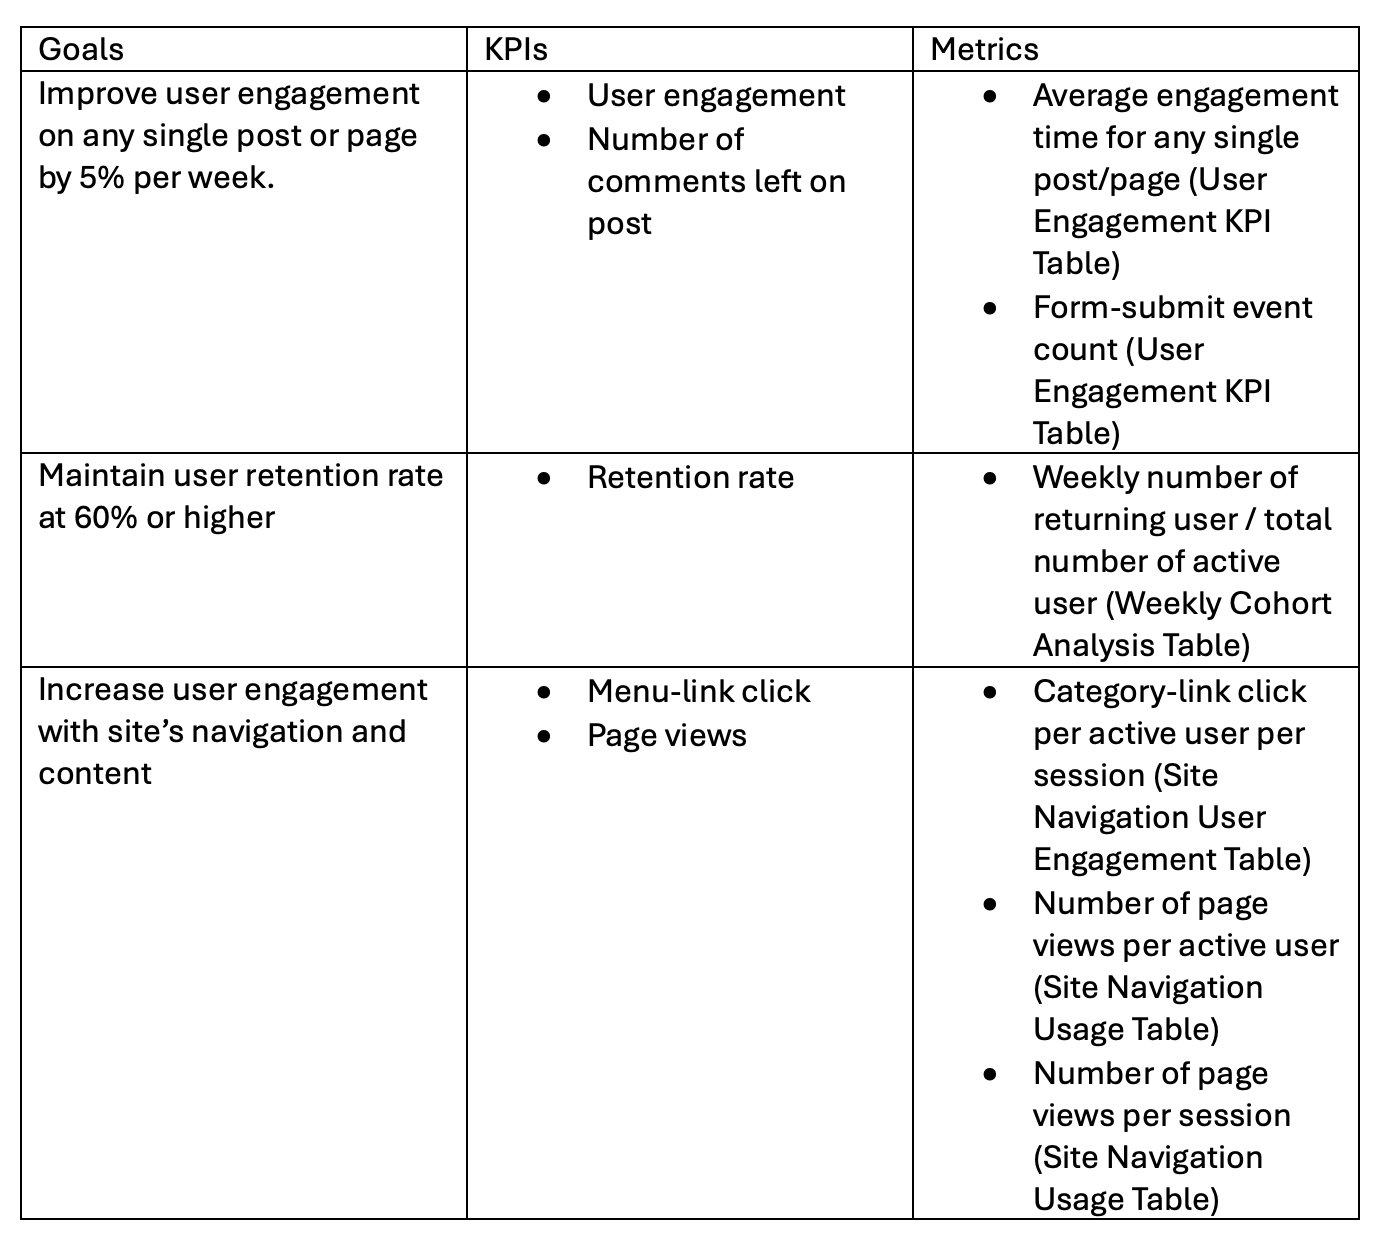
    My website content is centered around sharing personal life topics and new things that learned each week. Thus, one of the goals that I set is to improve user engagement throughout the course of the quarter. The key performance indicators for user engagement are the amount of time the users spent on reading a post and whether or not they leave a comment. Comment can be tracked with form submit event count. User engagement time is automatically tracked by GA4. I also created key events using Google Tag Manager to trigger if a user spend at least 30 seconds and 60 seconds on a post. Another goal that I set is to maintain user retention rate above 60%. This is measured by the amount of returning users each week over the total number of active users. For any business, it is very important to build a customer base and returning customers are what keep a business running. The third goal that I set is to improve navigation strategy and encourage users to use the navigation bar to explore new posts. The KPIs for this goal are menu-link click and page views. I have a menu-link click key event created and trigger in Google Tag manager. The number of page views per users is typically tracked by GA4 by default.

    Essay III. Summary of your Looker Studio Report with your KPI identified (add screenshots) (one paragraph)

    The link to my Locker Studio report is embeded below.

    Click Link to view Looker Studio Report

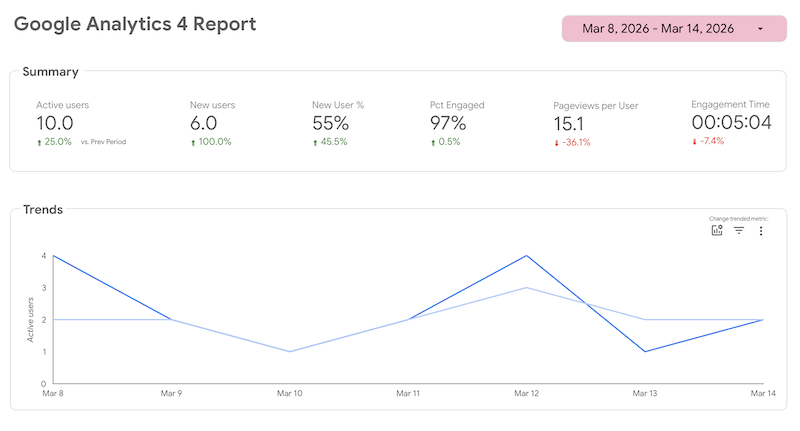
    This report was created using the standard GA4 report template in Looker Studio. The report has a time filter to allow the viewers to change the date range that they wish to see. The first page of the report includes a summary of the number of active users and new users, percentage of engagement and engagement time. It can be observed that there are 10 active users in the past week and the average engagement time is 5 minutes.

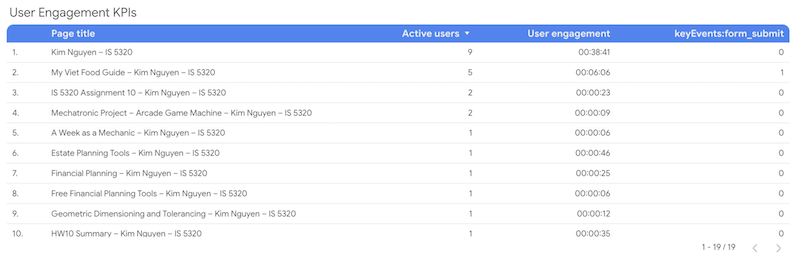
    To view user engagement in the report, I’ve created a custom table with columns showing the user engagement metrics that I’ve identified in the KPI table. The table shows a list of page title, number of active users, user engagement and form submit. It can be seen that my new post, My Viet Food Guide, has an average engagement time of 6 minutes with one comment. The other post, Mechatronic Project, has an engagement time of only 9 seconds. This suggests the type of content that visitors would like to see.

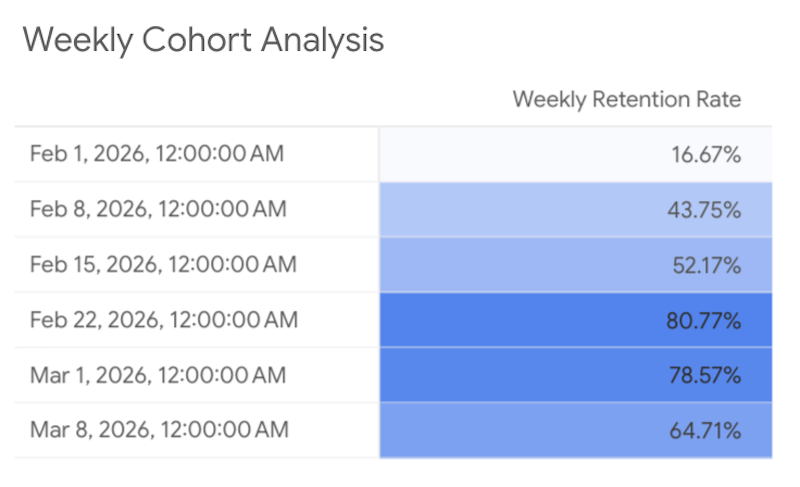
    Another custom table that I’ve added is the Weekly Cohort Analysis. This table is not included in the time filter and the data does not change when the view update the time range. My website begins receiving traffic from classmates starting end of January. Thus, I’ve created a custom dimension named Week Start properly display the time range. Weekly Retention Rate metric is calculated using the formula, (Total Users-New Users)/(Total Users). The number of returning users is equal to the total users minus new users. As observed from the table below, the percentages shown suggest that the retention rate for my website is quite low in the first three weeks. Starting week 4, this percentage increased significantly and is maintained above my target of 60% through the final week. The retention rate is increasing throughout each week, which suggests that the website is performing well and is building up a strong base of returning visitors.

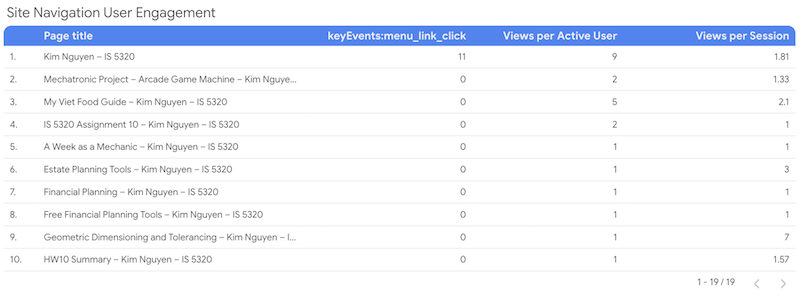
    My third KPI was to measure how visitors are using the navigation bar. The custom table shown below includes metrics such as menu link click, views per active user and views per session. From the data, it is observed that visitors are not using the navigation bar to view my posts. It is most likely that visitors access the site’s content by clicking on the links displayed on the homepage, which are typically new sticky posts that I pin to the homepage every week. Viewers might be using my home button to return to the main page to explore other contents after they’re done viewing a post. This is shown by the number of menu link clicks (11) that I have for my homepage. All the other pages except one has a zero count for menu link click. This insight suggests that I need major improvement to my navigation bar to encourage visitors to start using it more.

  • My Viet Food Guide

    Delicious Vietnamese noodle soups that are not Pho

    Bún bò Huế – Hue Beef Noodle Soup

    Image from Hungry Huy, Bún Bò Huế Recipe – Spicy Beef & Pork Noodle Soup

    Bún bò Huế is a flavorful noodle soup originate from the the city of Huế, the former capital of Vietnam and my mom’s hometown. The dish is known for its rich broth made from beef and pork bones. What makes this dish special is the use of fermented shrimp paste, which gives it its distinctive strong smell and bold taste, making it less popular to foreigners. The dish’s toppings include thinly sliced beef, Vietnamese pork sausage and congealed pig blood. This dish is often served with a side platter of fresh herbs and vegetables.

    Bún riêu – Crab Noodle Soup

    Image from My Viet Kitchen, Vietnamese Crab Noodle Soup (Bún Riêu Cua) – Authentic Recipe Guide

    Bún riêu is a noodle soup made with pork-bone and seafood based broth. Its reddish-orange color is a combination of shrimp head fat, tomatoes and annatto oil. What makes this dish unique is a special topping in the form of “meatball” made from crab meat, shrimp and eggs, which floats to the top of the soup when it cooks. Other ingredients include fried tofu, congealed pig blood and tomatoes. Similar with other Vietnamese noodle soups, this dish is served with a side fresh herbs and vegetables. Shrimp paste can also be added for enhanced flavor.

    Bún măng vịt – Duck Noodle Soup with Bamboo Shoots

    Image from Vào Bếp Cùng Diễm Nauy

    Bun Mang Vit is a Vietnamese rice vermicelli duck noodle soup with bamboo shoots. As the name suggests, the broth based is made from shimmering whole duck and saute bamboo shoots, giving it a savory-sweet flavor. Duck slices are served with a special dipping sauce made of ginger, fish sauce, sugar and hot chillies. Instead of herbs and vegetables, this dish is often enjoyed with a side of salad consists of shredded cabbage, onion and Vietnamese coriander dressed with sweet-and-sour vinegar.

    Mì Quảng Phan Thiết

    Image from PhanThietVn

    My personal favorite is Mì Quảng Phan Thiết. Mì Quảng is a noodle soup originates from the central region of Vietnam, Quảng Nam province. Each region of Vietnam has a different version of the dish. My hometown, Phan Thiết, is closer to southern Vietnam, which is characterized by a sweeter flavor profile compared to provinces in the central region. The version of the dish that I’m familiar with has a greater volume of soup compared to the original and is served with white rice noodle similar to Pho. The soup color is reddish orange from annatto oil and chili sate paste. Toppings include pork slices and pork trotters with a sprinkle of peanuts and lime for extra flavor.

    In contrast, the original dish has a golden yellow soup color primarily from turmeric, and is served with poached shrimp and sliced pork belly paired with crispy black sesame rice crackers. The noodle also has a golden-yellow color and is much thicker compared to Pho noodle. Below is an image of the original version of the dish.

    Image from Vicky Pham, Central Vietnam Must-Eat Noodle Dish: Mi Quang
  • Mechatronic Project – Arcade Game Machine

    One of the most fun and interesting projects that I’ve worked on during undergraduate was for a mechatronic class where I and my team designed and built and arcade game machine from scratch. The project inspiration started with the extra LED lights leftover from the midterm project. Our team wanted to exploit the power of LEDs and utilize them for the final. Many different ideas were considered, and we initially settled on a TV screen. The TV screen can be used for displaying animations and music videos, but the idea of a video game was enticing. Combining the two concepts, we started to work on wiring the LEDs to a prototype PCB. As the screen was being made, the idea of developing an Arcade cabinet to turn the TV screen into an Arcade machine inspired the team and this became our final project proposal. I was responsible for building the Pacman game and assisted with electrical wiring as well as programming music. Below is an embedded Youtube video of our final product.

    Arcade Cabinet Construction and Design Functionality

    The Arcade Cabinet was designed to mimic the functionality of a real video arcade machine. Functionality includes ergonomic joypad, ease of access for maintenance, glare shroud, electrical inner storage, and aesthetics. The main materials of the cabinet include popsicle sticks, hot glue, foam poster board, felt padding, a cup holder, and Rubbermaid plastic.

    The ergonomic joypad was covered in felt padding for comfort and was designed to be separate from the main cabinet to provide ease of access for maintenance. The maintenance access is essential for wire assembly and troubleshooting. The joystick and button wires feed under the joypad and into the electrical inner storage area, which is located at the base of the arcade cabinet. The electrical storage area is home to all the wires connecting to the uc32 microcontroller board. It is also home to a dual battery power source and twin speakers. A fun highlight of the team’s arcade machine is a cup holder for the user’s beverage. The cupholder is located on top of the cabinet, which sets just above the video screen.

    Electrical Design

    Wiring Diagram

    The size of the LED matrix was determined by the number of I/O pins available on the uC32, using all the pins on the right side and leaving the left side open for other devices. The arcade machine uses all but 3 I/O pins available.

    All wiring and routing is done on the prototype PCB, this eliminates the need for a breadboard and creates a more compact design, male and female headers are used to make connecting the prototype PCB to all other components easy and organized.

    LED Matrix

    The common anode RGB LEDs are wired in a matrix as depicted above. This method allows us to control 189 individual LEDs using only 30 pins. To turn on an LED, the desired row (C1-C9) is set to HIGH and the desired colors are set to LOW. while it’s possible to set the entire row at once, each LED is scanned individually as the uC32 cannot supply enough power for multiple LEDs at once without losing color accuracy.

    Joypad

    The joypad is a simple input device consisting of a joystick and 3 separate momentary switches. Though it would have been possible to wire the buttons in a matrix to use less pins, the increased complexity was not worth opening a single pin. All inputs are digital and pulled down to ground when not activated and can be used simultaneously.

    Speakers

    The speakers were originally connected directly to the uC32 and ground. Due to the low but audible sound, a transistor was implemented to amplify the signal. In addition, potentiometers were added before the amplifier to control the volume of each speaker individually. Though it would have been possible to use the DAC on the uC32 for more sophisticated control of the speakers, however, the simpler control method suited the needs for the project.

    Featured Games

    The Arcade machine menu is a selection of games consisting of Tetris and Pacman. The Tetris game is played with two push buttons and the joystick. The push buttons are used to change the block orientation and the joystick allows the block to be moved left, right, up and down the screen. There is no level up in the game. However, the game difficulty increases with each additional line completed. The Pacman game utilizes only the joystick as physical input. The user can move Pacman in four directions, left, right, up and down the maze. The game has four main built-in levels with increasing difficulty in the maze pattern and in the ghosts’ speed. From the main menu, the user can also listen to Jingle Bell while watching the colored Christmas tree being displayed on the screen.

  • HW9 Summary

    Time Log Teams – time spent on other Teams’ sites (must have 3 entries or more):
    Date: Mar. 2, 2026 From: 08:00pm To: 08:30pm
    Date: Mar. 6, 2026 From: 9:30pm To 10:00pm
    Date: Mar. 7, 2026 From: 6:20pm To: 7:00pm
    Date: Mar. 8, 2026 From: 03:30am To: 04:00am

    Time Log Students
    – time spent on other students’ sites (must have 3 entries or more):
    Date: Mar. 2, 2026 From: 08:30pm To: 09:00pm
    Date: Mar. 6, 2026 From: 10:00pm To: 10:30pm
    Date: Mar. 7, 2026 From: 05:15pm To: 06:20pm
    Date: Mar. 8, 2026 From: 03:00am To: 03:30am

    Essay I. Summary of your activities in your contents including new contents created (one paragraph). Provide all the hyperlinks (clickable) of new contents you have created this week.

    I created two new posts this week, one is titled Estate Planning Tools and the other is titled Geometric Dimensioning and Tolerancing (GD&T). The Estate Planning Tools post is placed under Financial Planning category. This post provides information on some of the estate planning tools that I’ve been researching about, including how to use and the pros and cons of each tool. I also updated the Financial Planning category page to include additional recommended books with links to purchase from Amazon. The second post on GD&T is placed under My Learning category where I continue to share what I’ve been learning at work through various trainings. I added new tags for each post and marked the two new posts as sticky posts on my homepage to increase web traffic. I created the HW9 page where users can access the new contents and homework summary for this week.

    Estate Planning Tools

    Geometric Dimensioning and Tolerancing

    Financial Planning Category

    My Learning Category

    HW9

    Essay II. Summary/analysis of your ‘automatic insights’ (add screenshots) (one paragraph)

    I’ve tried multiple methods to view automatic insights within my GA4 account. The first method where I tried to access insights from the report menu did not give me any result. This could be due to my site not getting sufficient traffic and not getting sufficient data to generate automatic insights. The second method where I tried to access insights from the small icon at the top right corner of the console allowed me to ask AI suggested questions such as “How many users did I have last week?” and “On what days do I get the most users?”. Over the past week, my site has 14 active users and the day that gets the most traffic is Saturday. I also learned that the most popular post is My Spring Break Plan with 11 views. The Thank You page and HW8 Summary also get a good number of views. I also tried method 3 using the search bar to ask Analytics Advisor. This tool also give me AI suggested questions to ask such as “what are the top 10 browsers by active users?”. I was able to quickly learned that Chrome is the most popular, followed by Safari and Edge.

    Essay III. Summary/analysis of your ‘custom insights’ (add screenshots) (one paragraph)

    I created several custom insights including daily report of number of active user, average engagement time per active user, event count per active user and key events count. These custom insights generally take about 24-48 hours to trigger. This allows time for new data to be collected. A notification email will be sent to me when these insights are available. I’ve also created all the suggested custom insights such as anomaly in daily event count, anomaly in daily users and daily views, and anomaly in daily key events. My site does not generate revenue so I left out anomaly in daily revenue from custom insights. AI generated automatic insights and custom insights are quick great ways to help me monitor daily traffic and understand users’ behaviors when visiting my website. A quick snapshot of the collected data shows that life related content seems to be more popular and attract greater users’ engagement compared to posts with technical content. Users are also more likely to give comments on personal content. This might be because users are less familiar with some of the technical engineering concept discussed in my posts or don’t find it very interesting.

  • Geometric Dimensioning and Tolerancing

    Image from Autodesk, Geometric dimensioning and tolerancing (GD&T) in design and manufacturing

    In the past couple weeks, I attended another training session at work on Geometric Dimensioning and Tolerancing (GD&T).

    GD&T is a symbolic language used in engineering drawings to define and communicate tolerances or allowable variations in a part. GD&T is governed by ASME Y14.5 standard and is widely used in industries requiring high-precision components such as aerospace and automotive.

    GD&T is a topic that I had briefly learned about in my undergraduate curriculum but had never had the proper training to fully understand the tool. In my early career, it was discouraged to use GD&T in my engineering because it tends to increase the cost of the parts due to high inspection requirements. However, if use correctly, GD&T can reduce the total manufacturing costs by removing ambiguity in the interpretation of design intent, improve assembly fit by allowing functional tolerances and reduce scrap rate. It provides a way for companies to control the quality of parts received from the suppliers and prevents disputes that might lead to increase in procurement cost.

    GD&T History

    The concept of GD&T was developed by Stanley Parker, an engineer at the Royal Torpedo Factory in Scotland during World War II. He observed wartime production issue where many parts were being rejected due to imperfect measurements. Even in cases where the discrepancy is small, the parts still fail to meet functional requirements. Parker then came up with the concept of true position (the theoretical exact location of a feature on a part) and tolerance zone (the specific 3D space or boundary that constrain the variation of a feature). In 1940s, the U.S. military developed the first standards for GD&T, MIL-STD-8. In 1982, the American Society of Mechanical Engineers (ASME) released the Y14.5 standard, which inherited and modernized those principles established from the original MIL-STD-8. The latest revision of ASME Y14.5 standard was released in 2018.

    Image from Metal Craft Industries

    GD&T Feature Control Frame

    Image from Fictiv, GD&T 101: Our Guide to Geometric Dimensioning and Tolerancing

    The GD&T feature control frame is used to specify the tolerance values acceptable for a feature of a part. The tolerance value is the difference between the minimum and maximum dimension limits. For example, in the image above, the size of the feature is specified using a diameter symbol with a value 9 and a tolerance zone of plus or minus 0.25. The feature modifier Ⓜ is used to define additional tolerance of 0.500 at maximum material condition (smallest hole or largest pin). The feature is inspected relative to datum features A, B and C (a physical surface or an edge used as a physical contact point for inspection equipment) in order of importance, primary, secondary and tertiary datums.

    GD&T Pros and Cons

    Image from Eziil, What Are Tolerances in Engineering?

    GD&T provides a clear and complete way to communicate part design intent. It is universally interpretable, meaning that it can be understood in the same by all engineers, suppliers, manufacturers and quality inspectors. GD&T maximizes manufacturer’s freedom and thereby reduces costs.

    One disadvantage of GD&T is that it adds complexity to the drawings during design and review. The language might not be interpret and understood correctly by all manufacturers if not property trained.

    References

    “GD&T Basics – A Comprehensive Introduction to Geometric Dimensioning and Tolerancing.” Five Flute, www.fiveflute.com/guide/gd-t-basics-a-comprehensive-introduction-to-geometric-dimensioning-and-tolerancing/. Accessed 7 Mar. 2026.

    “Geometric Dimensioning and Tolerancing (GD&T) in Design and Manufacturing.” Autodesk, www.autodesk.com/solutions/geometric-dimensioning-and-tolerancing. Accessed 7 Mar. 2026.

    Lindenberger, Chris A. “Definition of Terms- Tolerance Zones.” Metalcraft, 11 Nov. 2018, metalcraftind.com/definition-of-terms-tolerance-zones/.

    “Precision Edge: Bilateral & Unilateral Tolerance.” EZIIL, eziil.com/tolerance-types/. Accessed 7 Mar. 2026.

    Willson, David, et al. “GD&T 101: Our Guide to Geometric Dimensioning and Tolerancing.” Fictiv, www.fictiv.com/articles/gdt-101-an-introduction-to-geometric-dimensioning-and-tolerancing. Accessed 7 Mar. 2026.