Time Log Teams – time spent on other Teams’ sites (must have 3 entries or more):
Date: Mar. 2, 2026 From: 08:00pm To: 08:30pm
Date: Mar. 6, 2026 From: 9:30pm To 10:00pm
Date: Mar. 7, 2026 From: 6:20pm To: 7:00pm
Date: Mar. 8, 2026 From: 03:30am To: 04:00am
Time Log Students – time spent on other students’ sites (must have 3 entries or more):
Date: Mar. 2, 2026 From: 08:30pm To: 09:00pm
Date: Mar. 6, 2026 From: 10:00pm To: 10:30pm
Date: Mar. 7, 2026 From: 05:15pm To: 06:20pm
Date: Mar. 8, 2026 From: 03:00am To: 03:30am
Essay I. Summary of your activities in your contents including new contents created (one paragraph). Provide all the hyperlinks (clickable) of new contents you have created this week.
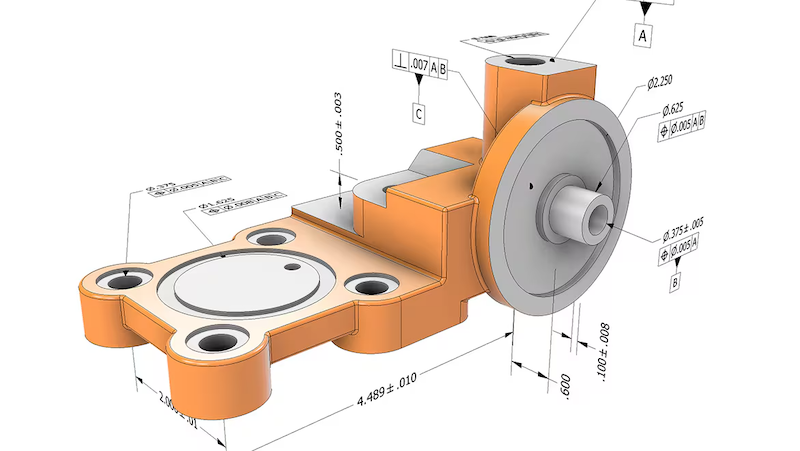
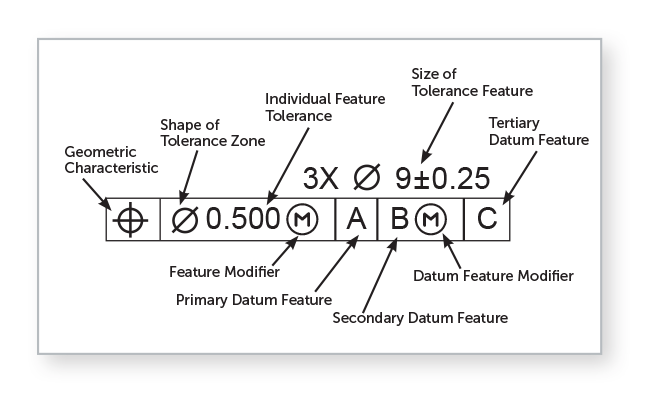
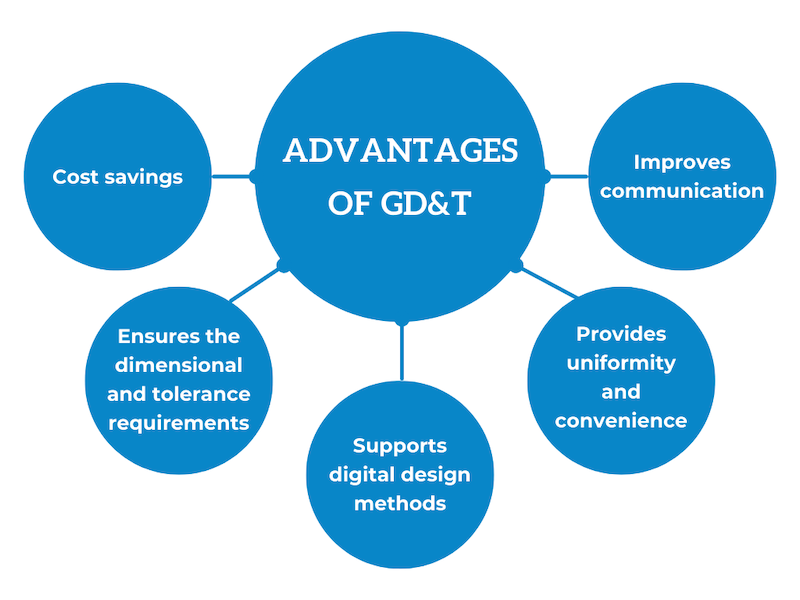
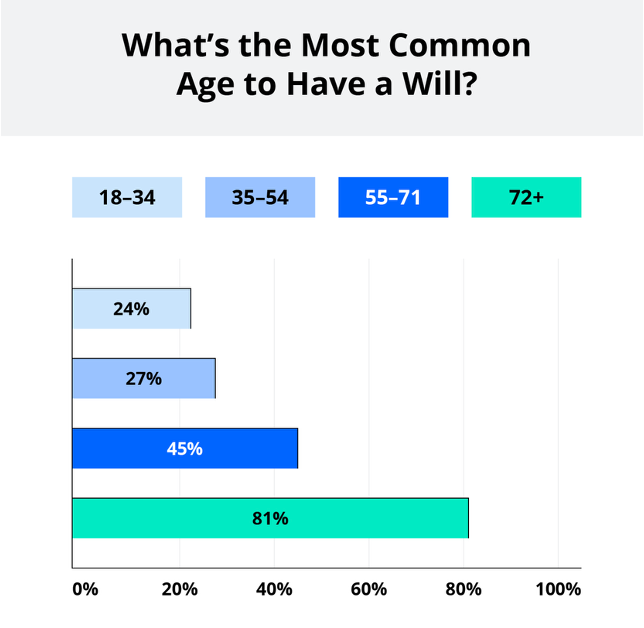
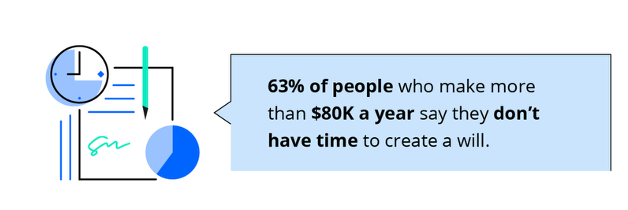
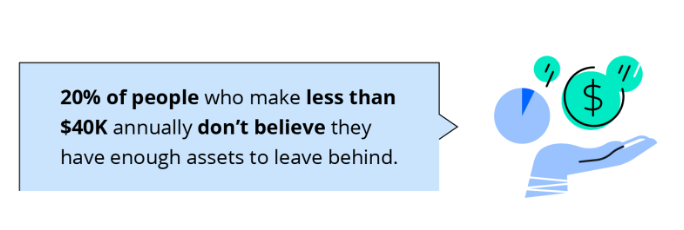
I created two new posts this week, one is titled Estate Planning Tools and the other is titled Geometric Dimensioning and Tolerancing (GD&T). The Estate Planning Tools post is placed under Financial Planning category. This post provides information on some of the estate planning tools that I’ve been researching about, including how to use and the pros and cons of each tool. I also updated the Financial Planning category page to include additional recommended books with links to purchase from Amazon. The second post on GD&T is placed under My Learning category where I continue to share what I’ve been learning at work through various trainings. I added new tags for each post and marked the two new posts as sticky posts on my homepage to increase web traffic. I created the HW9 page where users can access the new contents and homework summary for this week.
Geometric Dimensioning and Tolerancing
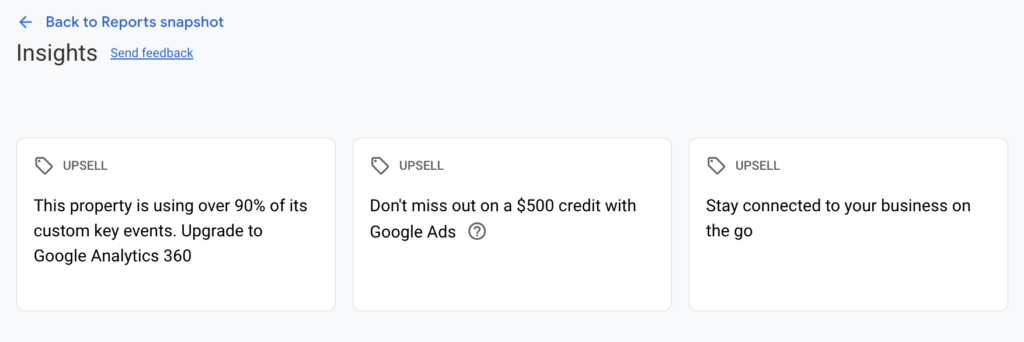
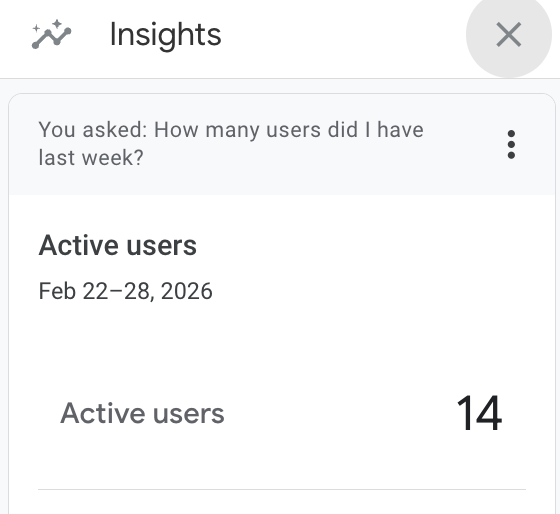
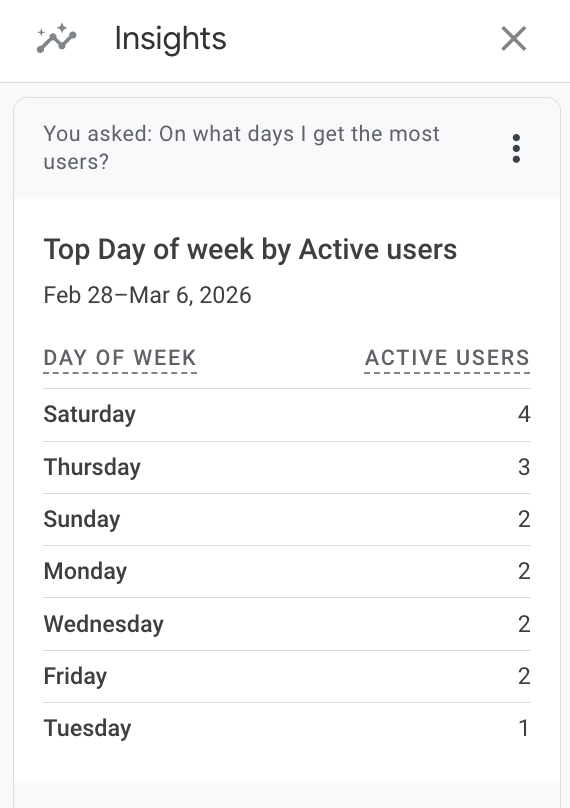
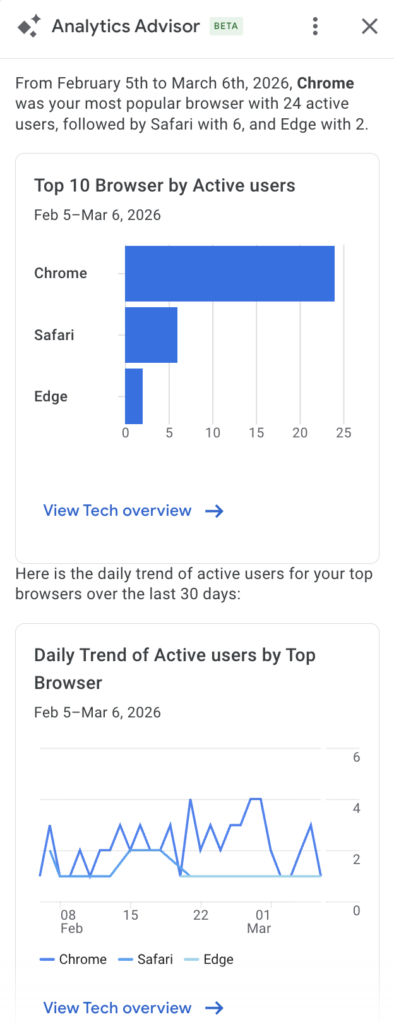
Essay II. Summary/analysis of your ‘automatic insights’ (add screenshots) (one paragraph)
I’ve tried multiple methods to view automatic insights within my GA4 account. The first method where I tried to access insights from the report menu did not give me any result. This could be due to my site not getting sufficient traffic and not getting sufficient data to generate automatic insights. The second method where I tried to access insights from the small icon at the top right corner of the console allowed me to ask AI suggested questions such as “How many users did I have last week?” and “On what days do I get the most users?”. Over the past week, my site has 14 active users and the day that gets the most traffic is Saturday. I also learned that the most popular post is My Spring Break Plan with 11 views. The Thank You page and HW8 Summary also get a good number of views. I also tried method 3 using the search bar to ask Analytics Advisor. This tool also give me AI suggested questions to ask such as “what are the top 10 browsers by active users?”. I was able to quickly learned that Chrome is the most popular, followed by Safari and Edge.
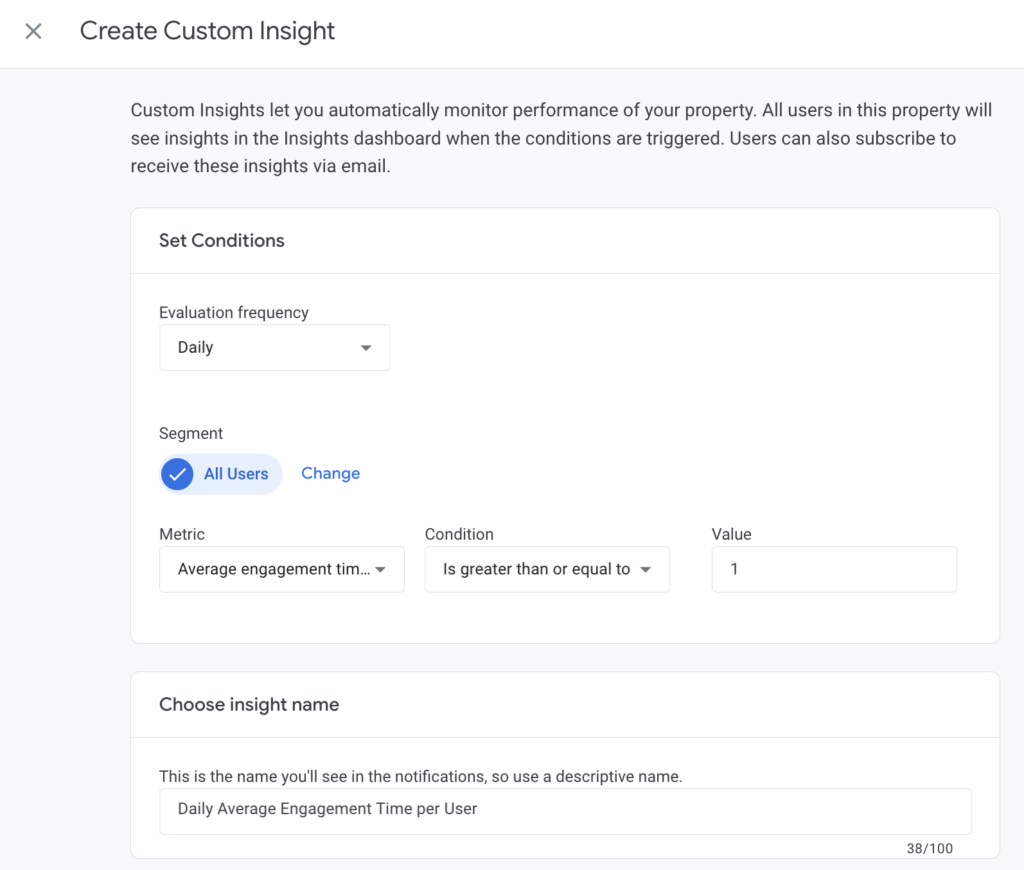
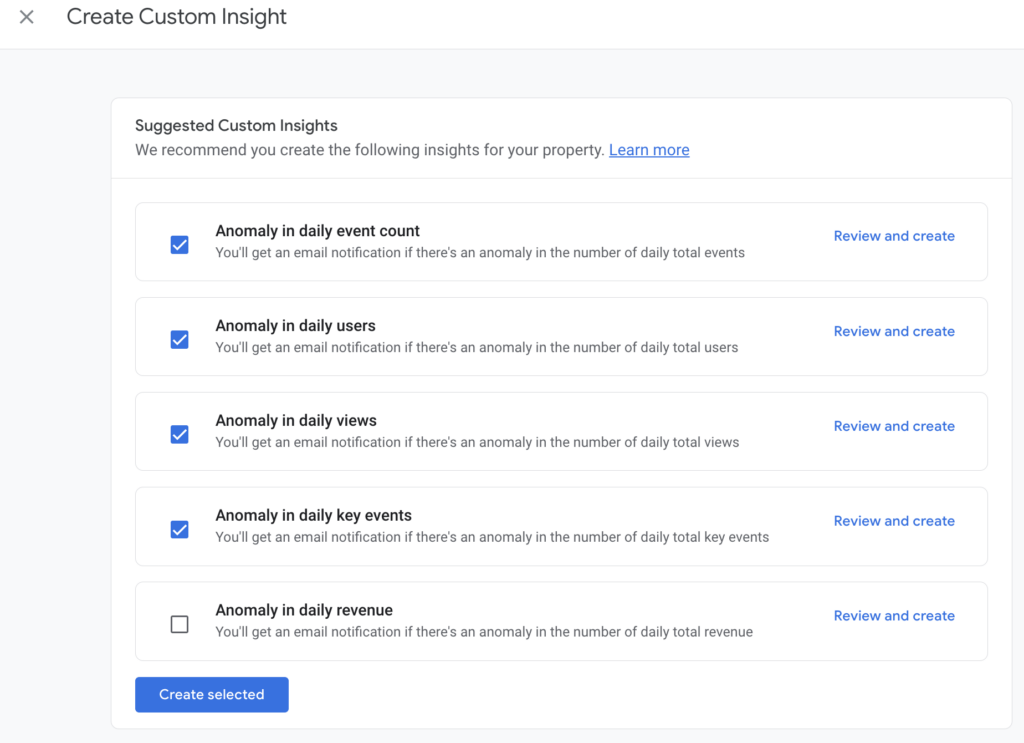
Essay III. Summary/analysis of your ‘custom insights’ (add screenshots) (one paragraph)
I created several custom insights including daily report of number of active user, average engagement time per active user, event count per active user and key events count. These custom insights generally take about 24-48 hours to trigger. This allows time for new data to be collected. A notification email will be sent to me when these insights are available. I’ve also created all the suggested custom insights such as anomaly in daily event count, anomaly in daily users and daily views, and anomaly in daily key events. My site does not generate revenue so I left out anomaly in daily revenue from custom insights. AI generated automatic insights and custom insights are quick great ways to help me monitor daily traffic and understand users’ behaviors when visiting my website. A quick snapshot of the collected data shows that life related content seems to be more popular and attract greater users’ engagement compared to posts with technical content. Users are also more likely to give comments on personal content. This might be because users are less familiar with some of the technical engineering concept discussed in my posts or don’t find it very interesting.